
Simulated Market Analysis Tick by Tick
Backtesting – “Back Testing is a technique used to reconcile forecasted losses from VaR with actual losses at the end of the time horizon” this is a direct quote from JPMorgan ( we recommend reading this article) if you would like a simplified version of the same concept please see this page (http://www.guidetogettingrichwithforexrobots.com/)
Our “Simulation” Reports (otherwise known as backtesting) are reflections of our trading algorithm as is would have performed across a historical date range. We use tick-by-tick data for the best accuracy.
Our Current System with a fixed 1 lot trade
Euronis Version v8xxx Current System: Sept 2013
These settings are live here: http://www.myfxbook.com/members/EURONIS/live/765876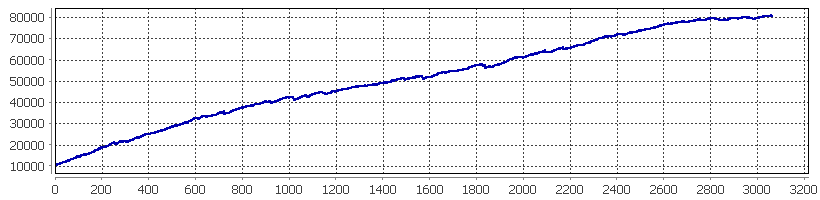
| Symbol | GBPCAD, EURCAD, AUDNZD, EURUSD | ||||
| Period | 2011.09.26 16:28 – 2014.01.17 22:00 | ||||
| Initial deposit | $10000.00 | ||||
| Total net profit | $70563.50 | Gross profit | $123240.25 | Gross loss | $-52676.75 |
| Profit factor | 2.34 | Expected payoff | $23.037 | ||
| Absolute drawdown | 0.00 | Maximal drawdown | $1880.54 (3.238%) | Relative drawdown | 5.048% ($1068.00) |
| Total trades | 3063 | Short positions (won %) | 1667 (80.804%) | Long positions (won %) | 1396 (76.791%) |
| Profit trades (% of total) | 2419 (78.975%) | Loss trades (% of total) | 644 (21.025%) | ||
| Largest | profit trade | $195.00 | loss trade | $-559.38 | |
| Average | profit trade | $50.947 | loss trade | $-81.796 | |
| Maximum | consecutive wins (profit in money) | 32 ($1735.94) | consecutive losses (loss in money) | 7 ($-417.08) | |
| Maximal | consecutive profit (count of wins) | $1735.94 (32) | consecutive loss (count of losses) | $-1303.44 (6) | |
| Average | consecutive wins | 6 | consecutive losses | 1 | |
Our Current System with compounded risk
Euronis Version v8xxx Current System: Sept 2013
These settings are live here: http://www.myfxbook.com/members/EURONIS/live/765876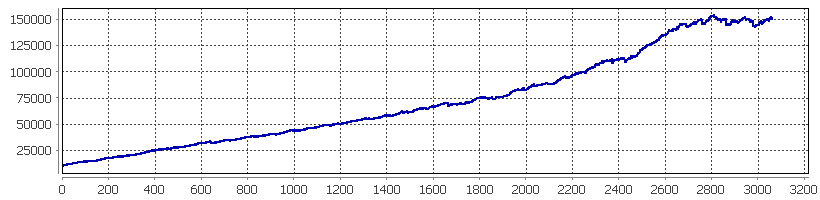
| Symbol | GBPCAD, EURCAD, AUDNZD, EURUSD | ||||
| Period | 2011.09.26 16:28 – 2014.01.17 22:00 | ||||
| Initial deposit | $10000.00 | ||||
| Total net profit | $139699.34 | Gross profit | $303957.60 | Gross loss | $-164258.26 |
| Profit factor | 1.85 | Expected payoff | $45.609 | ||
| Absolute drawdown | 0.00 | Maximal drawdown | $10949.35 (7.125%) | Relative drawdown | 7.125% ($10949.35) |
| Total trades | 3063 | Short positions (won %) | 1667 (80.804%) | Long positions (won %) | 1396 (76.791%) |
| Profit trades (% of total) | 2419 (78.975%) | Loss trades (% of total) | 644 (21.025%) | ||
| Largest | profit trade | $785.12 | loss trade | $-5550.50 | |
| Average | profit trade | $125.654 | loss trade | $-255.059 | |
| Maximum | consecutive wins (profit in money) | 32 ($1734.99) | consecutive losses (loss in money) | 7 ($-2442.78) | |
| Maximal | consecutive profit (count of wins) | $5302.35 (19) | consecutive loss (count of losses) | $-5550.50 (1) | |
| Average | consecutive wins | 6 | consecutive losses | 1 | |
Version 7xxx is shown below.
This shows the DrawDown on our live accounts.
These backtests include commission. The also have very close DD and Profit Factor numbers ( its very close to live trading because we use tick-by-tick data)Our Old System
Euronis Version 7xxx Old System: NOV 2012
These settings are live here: http://www.myfxbook.com/members/EURONIS/206/584532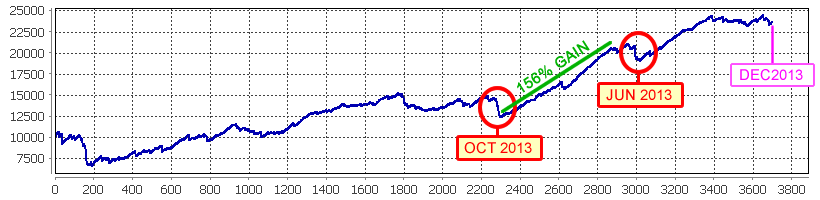
| Pairs Traded | GBPCAD, EURCAD Download v7xxx_trade history in CSV | ||||
| Tick Data Period Used | 2011.09.26 17:52 – 2013.12.05 21:11 | ||||
| Initial deposit | $10,000.00 | ||||
| Total net profit | $13,591.93 | Gross profit | $68,748.46 | Gross loss | $-55,156.53 |
| Profit factor | 1.246 | Expected payoff | $3.673 | ||
| Maximal drawdown | $4,000.52 (37.859%) | Relative drawdown | 37.859% ($4,000.52) | ||
| Total trades | 3,700 | Short positions (won %) | 1,894 (80.306%) | Long positions (won %) | 1,806 (80.066%) |
| Profit trades (% of total) | 2,967 (80.189%) | Loss trades (% of total) | 733 (19.811%) | ||
| Largest | profit trade | $28.35 | loss trade | $-741.39 | |
| Average | profit trade | $23.171 | loss trade | $-75.248 | |
| Maximum | consecutive wins (profit in money) | 43 (916.40) | consecutive losses (loss in money) | 5 (-336.41) | |
| Maximal | consecutive profit (count of wins) | $916.40 (43) | consecutive loss (count of losses) | -1,523.25 (5) | |
| Average | consecutive wins | 6 | consecutive losses | 2 | |