
7.5 years of history, 10,000 USD start
7 May 2019 to 15 November 2026 · 100% real ticks of NASDAQ 100 futures on a matching US100 CFD symbol · 3% risk per trade
Futures price data, not IC Markets data. Shown for length of history. The futures commission of 0.59 per side, 7,566.16 in total, is charged in this test as withdrawals. The figures below are after commission, unless marked.
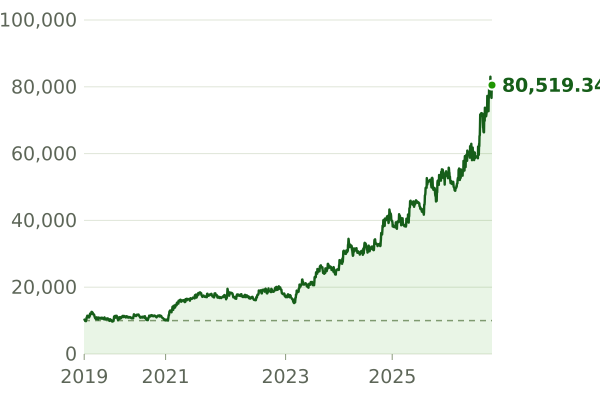
Account balance after each closed trade and its commission, drawn from the deals list of the test. Horizontal axis: the trades in order, marked by year.
Year by year, after commission
| Year | Trades | Net profit | Return | Worst balance drop |
|---|---|---|---|---|
| 2019 (from July) | 107 | +222.88 | +2.2% | 19.0% (2,400.35) |
| 2020 | 239 | -134.80 | -1.3% | 15.2% (1,806.26) |
| 2021 | 246 | +7,006.14 | +69.4% | 9.3% (1,717.33) |
| 2022 | 264 | +143.30 | +0.8% | 17.6% (3,429.07) |
| 2023 | 227 | +7,919.52 | +45.9% | 11.9% (3,225.31) |
| 2024 | 226 | +14,606.96 | +58.1% | 14.8% (5,104.35) |
| 2025 | 230 | +14,952.90 | +37.6% | 13.5% (7,125.22) |
| 2026 (to 6 November) | 195 | +25,802.44 | +47.2% | 12.4% (6,917.79) |
| All years | 1,734 | +70,519.34 | +705.2% | 24.7% (5,010.96) |
Return is the year's net profit divided by the balance at the start of that year, and the first year starts at 10,000. Worst balance drop is the largest fall from a peak, measured on the balance after each trade and commission. The all years figure runs across year ends. The year sums add up to the net profit after commission.
The Strategy Tester prints these statistics before commission: net profit +78,085.50, profit factor 1.32, 43.83% winners, worst balance drop 21.14% and longest losing run 10. Commission of 7,566.16 is charged as withdrawals. Test 1 is shown for length of history. Tests 2 and 3 use IC Markets prices.

